Built for the moment you need it

Whatever your team is trying to answer, Cloudcraft starts from the same place: a live, accurate picture of what's actually running.

Incident response & troubleshooting

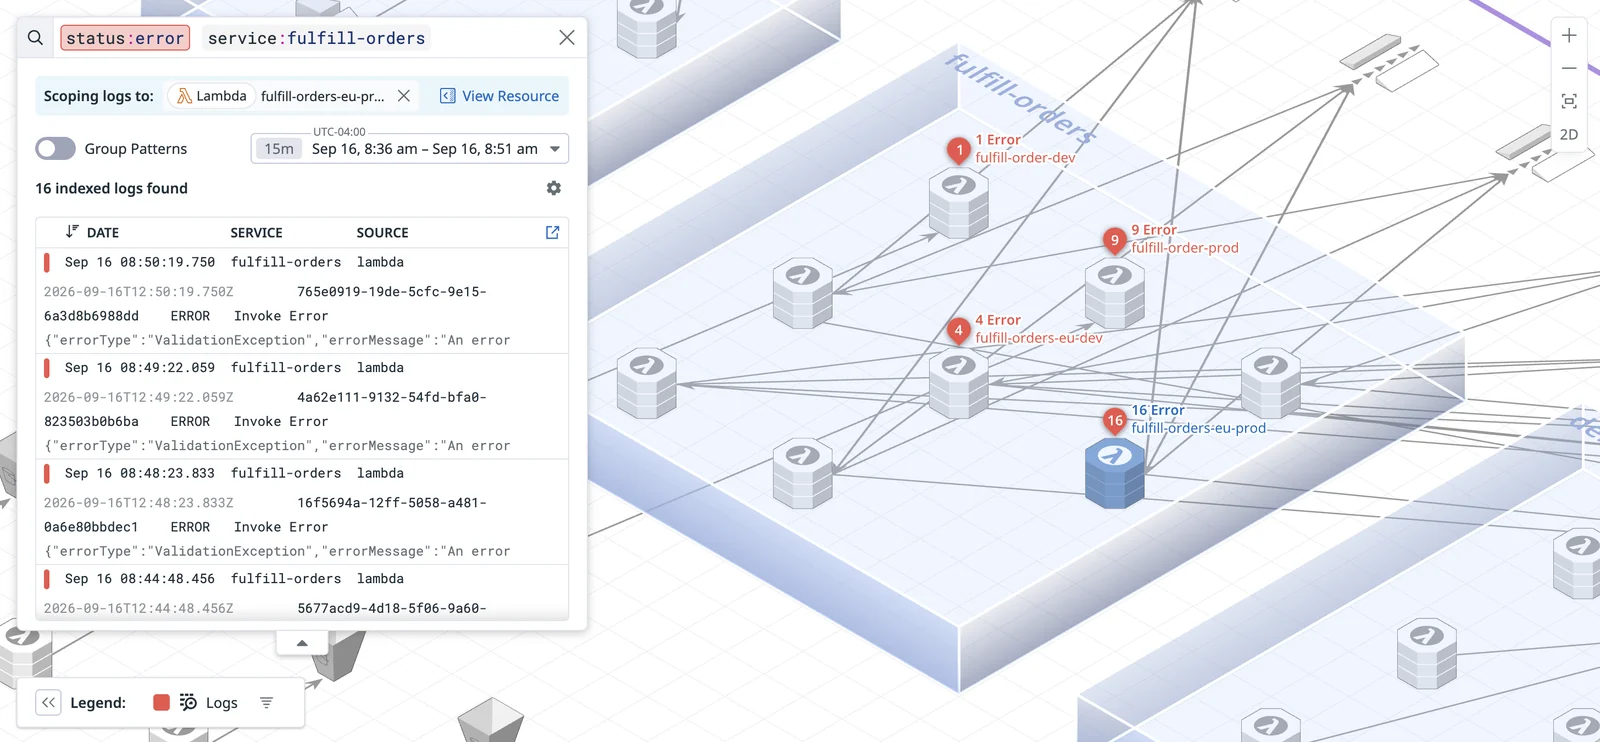
  • Visualize logs on the diagram and find error logs per resource to trace issues back to the source.
  • Click into any resource, service, function, or database to see its metrics, logs, and traces, making correlation fast and easy.
  • Visualize serverless architectures from API gateway to function to database
Error logs and connected resources shown directly on a live Cloudcraft diagram in Datadog
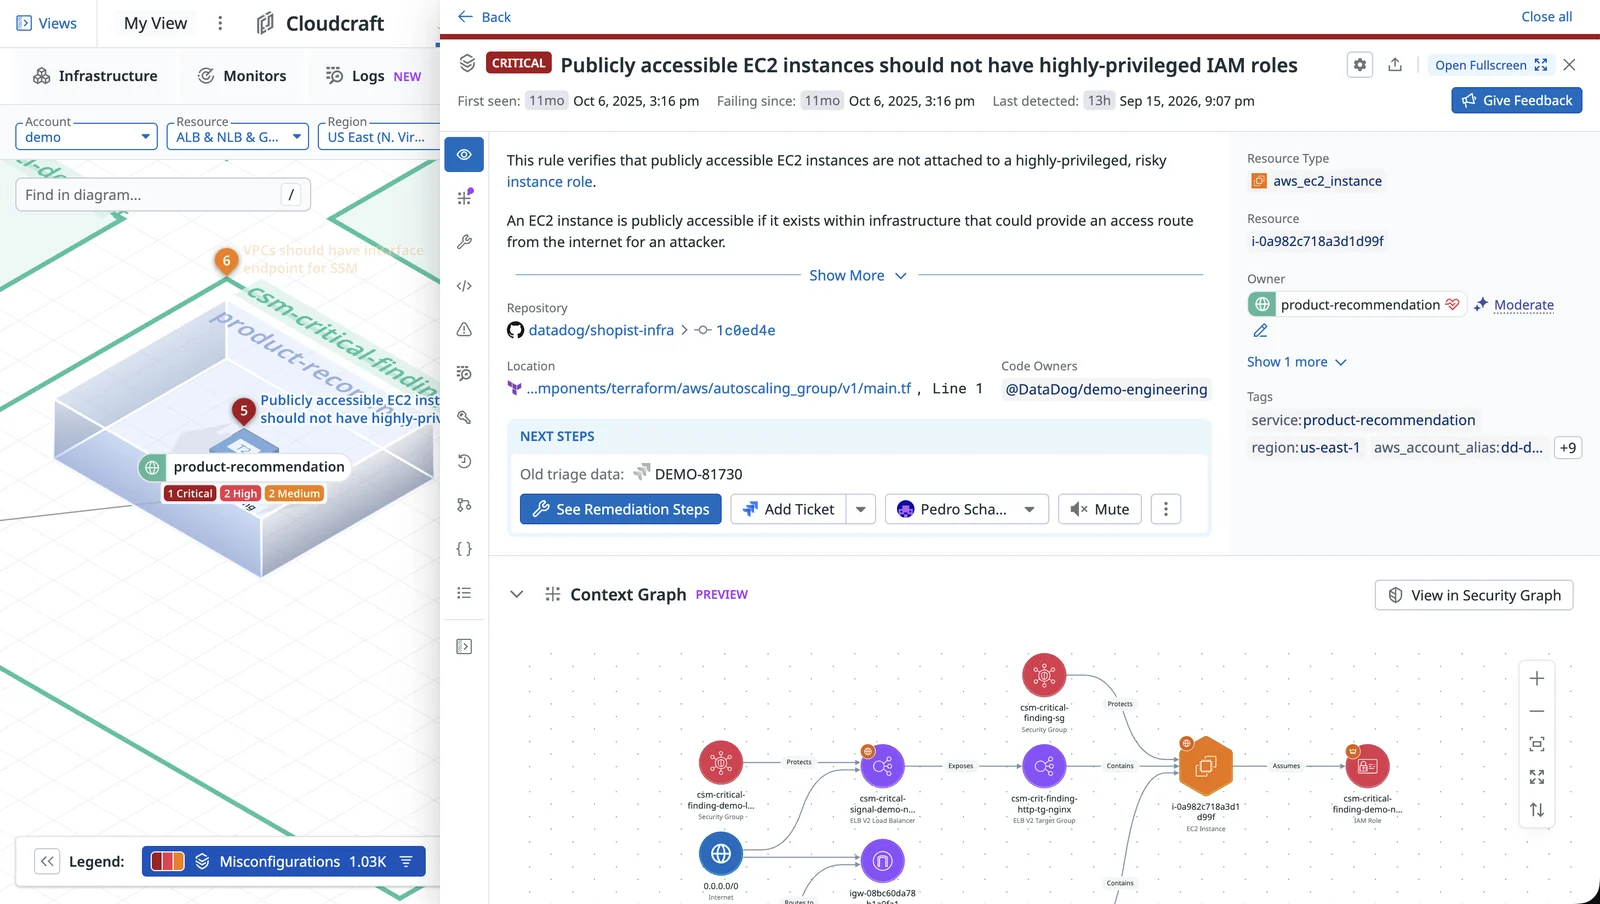
Security misconfigurations and vulnerabilities highlighted on the resources that have them

Security review

  • The security overlay shows a heatmap of misconfigurations and vulnerabilities directly on the resources that have them.
  • Prioritize what's exposed based on where it sits in your architecture, instead of a severity score with no context.
  • Click on a resource to see details of the security issue, the attack path, and remediation steps

Cost optimization

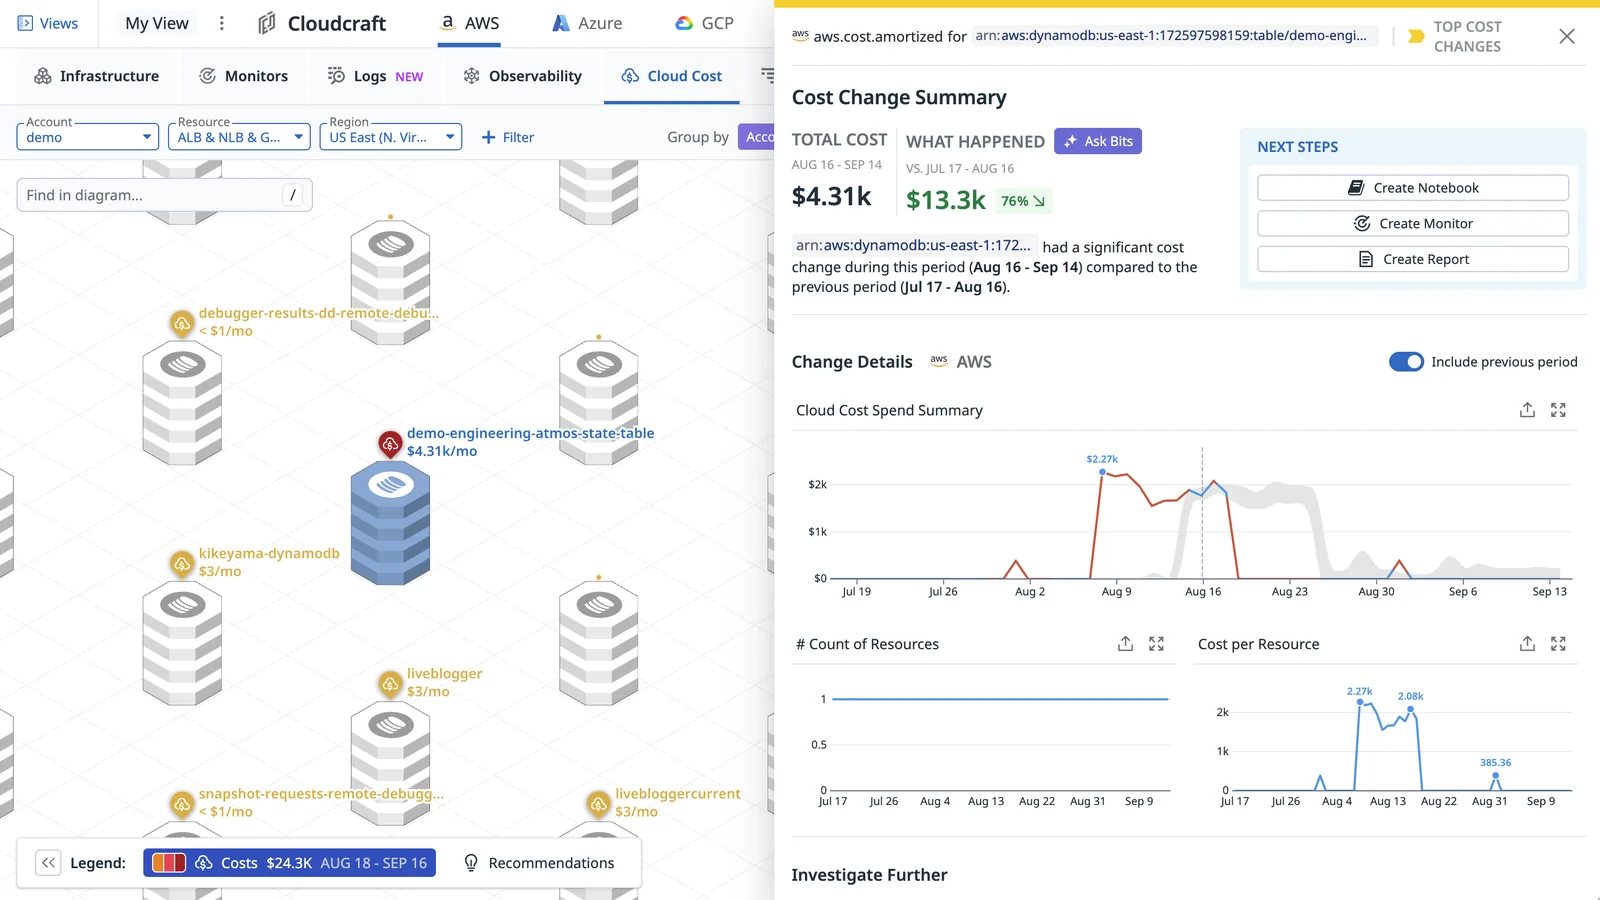
  • See a heatmap of true costs and savings directly on the resources that have them.
  • Find ownership of untagged services and resources by seeing how they connect to tagged infrastructure.
  • Click on a resource to see a history of costs over time, and breakdown of costs by type (compute, storage, data egress, etc.)
Cloud cost heatmap overlaid on a Cloudcraft infrastructure diagram, showing per-resource spend
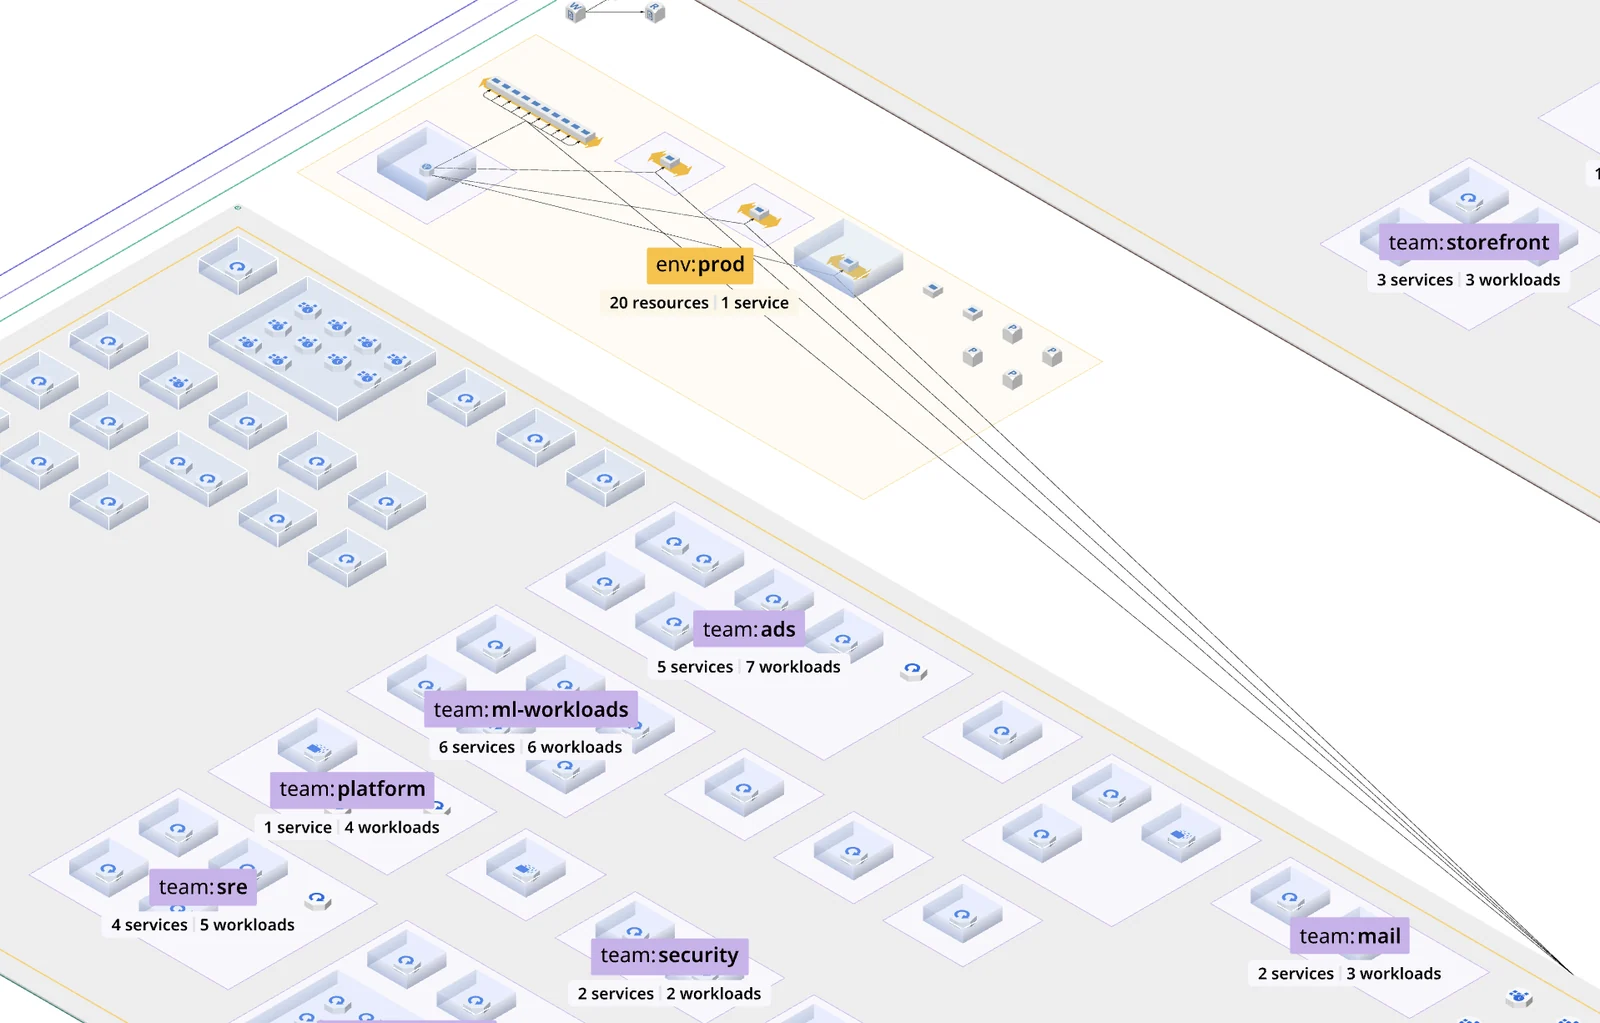
Cloudcraft diagram giving new team members an accurate picture of the infrastructure

Onboarding

  • New team members get an accurate picture of the infrastructure from day one, across cloud and on-prem.
  • The diagram updates automatically, so it stays a reliable reference instead of a doc that's outdated the week it's written.
  • Cloud architects can understand and communicate the infrastructure without (re)drawing it by hand.
  • Export diagrams to SVG or PDF for design, audits, and compliance.
  • Embed your infrastructure diagrams in dashboards to put metrics in context and help teams quickly drill down when there's a problem.

Works with the AWS, Azure, GCP, or OCI integrations you already have in Datadog. No agent required.